Comabbio
Cet article est une ébauche concernant une commune italienne et la Lombardie.
Vous pouvez partager vos connaissances en l’améliorant (comment ?) selon les recommandations des projets correspondants.
| Comabbio.mw-parser-output .entete.map{background-image:url("//upload.wikimedia.org/wikipedia/commons/7/7a/Picto_infobox_map.png")} | ||||
| Noms | ||||
|---|---|---|---|---|
| Nom latin (origine) | Comavius | |||
| Administration | ||||
Pays | ||||
Région | ||||
Province | Varèse | |||
Code postal | 21020 | |||
Code ISTAT | 012054 | |||
| Code cadastral | C911 | |||
| Préfixe tel. | 0331 | |||
| Démographie | ||||
Gentilé | comabbiesi | |||
Population | 1 181 hab. (31-12-2010[1]) | |||
| Densité | 248 hab./km2 | |||
| Géographie | ||||
Coordonnées | 45° 46′ 00″ nord, 8° 41′ 00″ est | |||
Altitude | 307 m Min. 243 m Max. 471 m | |||
Superficie | 476 ha = 4,76 km2 | |||
| Divers | ||||
Saint patron | S.Giacomo | |||
| Fête patronale | 25 juillet | |||
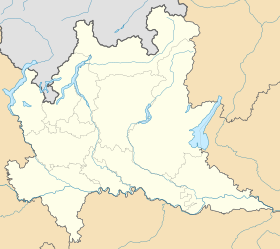
| Localisation | ||||
| Géolocalisation sur la carte : Lombardie
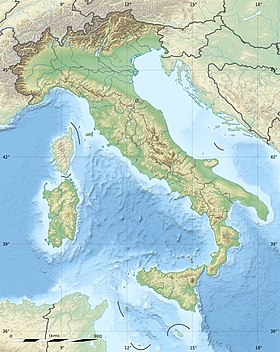
Géolocalisation sur la carte : Italie
Géolocalisation sur la carte : Italie
| ||||
| Liens | ||||
Site web | http://www.comune.comabbio.va.it/ | |||
modifier | ||||

Comabbio est une commune italienne d'environ 1 200 habitants située dans la province de Varèse dans la région Lombardie dans le nord de l'Italie.
Sommaire
1 Toponymie
2 Géographie
3 Histoire
4 Économie
5 Culture
6 Monuments et patrimoine
7 Administration
7.1 Hameaux
7.2 Communes limitrophes
8 Notes et références
Toponymie |
Le nom de la commune provient du nom latin de personne Comavius.
Géographie |
Cette section est vide, insuffisamment détaillée ou incomplète. Votre aide est la bienvenue ! Comment faire ?
Histoire |
Cette section est vide, insuffisamment détaillée ou incomplète. Votre aide est la bienvenue ! Comment faire ?
Économie |
Cette section est vide, insuffisamment détaillée ou incomplète. Votre aide est la bienvenue ! Comment faire ?
Culture |
Cette section est vide, insuffisamment détaillée ou incomplète. Votre aide est la bienvenue ! Comment faire ?
Monuments et patrimoine |
Cette section est vide, insuffisamment détaillée ou incomplète. Votre aide est la bienvenue ! Comment faire ?
Administration |
Hameaux |
Monte Pelada, C.na Zerbino, Careggio, C.na della Palude, sito delle Querce
Communes limitrophes |

Notes et références |
(it) Popolazione residente e bilancio demografico sur le site de l'ISTAT.
 Portail de la Lombardie